Introduction
Test–retest is a term used to describe the properties of measurement tools evaluated twice on different time occasions. During the last decades, many research reported on the two related but clearly different notions of test–retest, namely, reliability and agreement (e.g.
Bland and Altman, 1986;
Grenier et al., 2000;
Halligan, 2002;
Kottner et al., 2011;
Vieira and Corrente, 2011). In this study, following
Kottner et al. (2011), we define reliability as the capacity of a test or any other measurement tool to differentiate between respondents when measured twice under the same conditions. In other words, reliability is the capacity of a test to replicate the same ordering between respondents when measured twice. On the other hand, agreement is the capacity of a test or any other measurement tool applied twice on the same respondents under the same conditions to provide strictly identical results. Compared to reliability, agreement required not only to preserve the relative order of the respondents in the two sets of measurements but also the same exact result that each respondent obtains on the two testing occasions. Consequently, reliability can be considered as a necessary but not sufficient condition to demonstrate agreement. In the succeeding sections of this article, we will clearly distinguish between these two concepts, when “test–retest” will be used as a general term to mean any comparison between successive measurements.
The construction of a new measurement tool requires the examination of its psychometric properties, and these properties generally include some form of test–retest reliability. Unfortunately, the same is rarely done regarding test–retest agreement, and it appears that the difference between reliability and agreement is often simply ignored. In some cases, the two notions are even confounded and authors consider their measurements to be in agreement, when they are only reliable. Part of the confusion can certainly be attributed to the fact that the terms “reliability” and “agreement” are less than standard and that many synonymous terminologies are used in the literature (
Kottner et al., 2011). For example, “repeatability” is commonly used for agreement as well as for reliability. As established by
De Vet et al. (2006), in medical studies, agreement is often neglected and only reliability is evaluated, but researchers then often interpret their results as if agreement was nevertheless demonstrated.
Reliability is certainly directly related to the usefulness of a measurement tool. If the tool is not reliable, then it cannot provide useful information for the comparison of different respondents. However, agreement also is an essential feature to address any deficiency leading to the impossibility to distinguish between a real change in the examined person, and a random variation or a systematic deviation due to the test itself or the conditions of the testing. As established, a long time ago by
Guyatt et al. (1987), an instrument cannot be used to detect a change when its measurement error is larger than the change we want to be able to detect. This implies again the need to have measurement tools used in longitudinal studies evaluated not only for reliability but also for agreement. This last point is absolutely crucial because a trend in the human sciences is to collect and analyze data using longitudinal designs.
As an example, consider the case of the Internet Addiction Test (IAT) developed by
Young (1998). For years, there is much concern about the possible addictive nature of the Internet, especially among adolescents, and the IAT is the most widely used tool to evaluate this condition. However, the IAT was tested only for temporal reliability, using Pearson’s correlation, and not for agreement (e.g.
Jelenchick et al., 2012). Consequently, in the context of longitudinal studies aiming at evaluating the evolution of Internet addiction through time, a significant change in the IAT does not necessarily imply a real evolution of the respondents. It could also be caused by a possibly large random error. In this particular case, this hypothesis is not so unlikely, since the IAT is quite long to answer, with a list of 20 similar items, and the attention of adolescent users could be far from perfect.
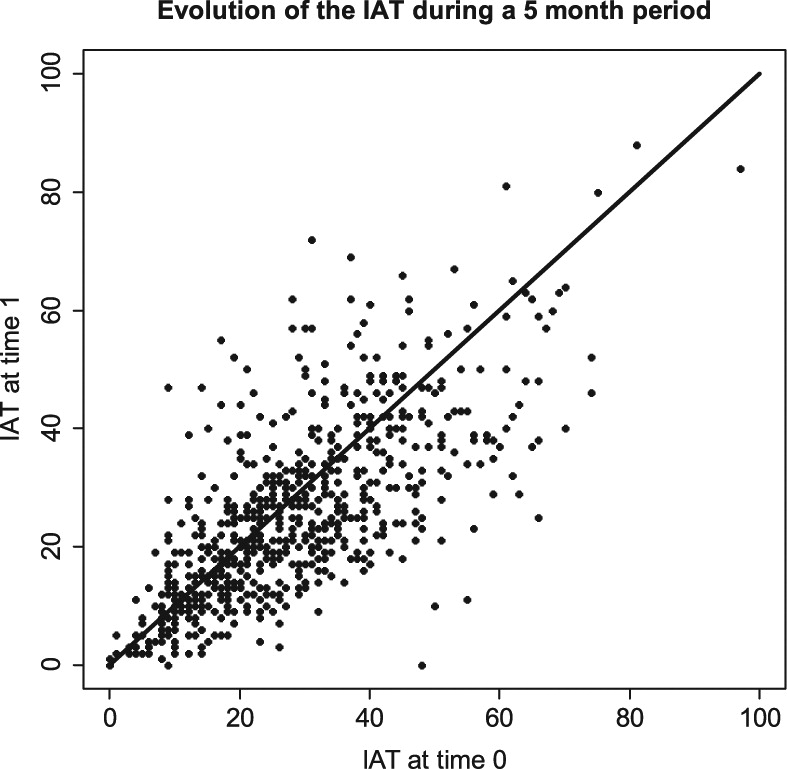
Consider the data shown in
Figure 1. These data are taken from the
[email protected] study, a longitudinal survey analyzing the use of Internet among adolescents living in the French part of Switzerland (
Surís et al., 2012). In the spring of 2012 (time 0), a sample of 3367 adolescents answered a questionnaire about their use of Internet. Among them, a subsample of
n = 678 adolescents (58% girls, mean age = 14.1 years) answered a second questionnaire 5 months later (time 1).
Figure 1 shows the IAT scores on both testing occasions.
As shown in
Figure 1, there seems to be a trend toward a slight decrease of the IAT between times 0 and 1, indicating an average lowering of possible addiction problems regarding the use of the Internet. This is confirmed by a paired
t-test (
t = −6.34,
df = 677,
p < 0.001). However, given the small amount of change between the two testing occasions (mean difference = −2.77) and the fact that the IAT was evaluated for reliability, but not for agreement, can we really conclude that the IAT score is lower at time 1 than it was at time 0? This change could also be the result of a measurement error, for instance, a kind of learning from the first filling of the questionnaire to the second one, therefore, the question is still open.
Current practices in research
For several years, we have tried to establish the properties of new evaluation tools considering both reliability and agreement. However, on the basis of our own experience, this need did not seem to be shared by all colleagues. For this reason, we decided to explore the recent literature evaluating the properties of psychometric tools with the objective of identifying the current practices regarding test–retest. Four journals publishing this kind of studies were selected (Assessment, Journal of Personality Assessment, Journal of Research in Personality, and European Review of Applied Psychology), and all research articles published in 2012 were analyzed. Papers describing clinical cases or new statistical tools, as well as book and software reviews, were not included. Similarly, papers citing test–retest results only in their review of the literature were not considered. Finally, we were interested only in continuous scores, therefore, papers presenting test–retest analyses for dichotomous or categorical variables were not considered. It is important to note that these journals were selected only because they regularly publish papers with test–retest assessments, but they are not meant to be representative of such journals, and it would make no sense to compare the results obtained from each of these four journals.
Table 1 summarizes our findings showing that, among the 24 research articles presenting a procedure of test–retest assessment on continuous scores, none used a method that is able to demonstrate agreement with certainty. We decided then to write this short paper as a reminder to the attention of the developers of new measurement tools, reviewers, and end users of such tools. This seemed important to us because, as demonstrated by the figures in
Table 1, many recently developed tools, as well as probably many more established tools, are not as precise as they are supposed to be, especially when used in a longitudinal context.
As discussed in the next section, some papers used an intra-class correlation coefficient (ICC), but without indicating precisely which one was used. In these cases, it was not possible to determine which test–retest property was evaluated. Moreover, some papers using correlation discussed about “test–retest correlation.” In some sense, their computations were then correct, since they did not pretend to examine the notion of agreement, but it is dubious that they really intended to only examine the correlation coefficient. Notice also that some of the measures described in this article can be extended to more than two sets of successive measurements, but it is not our purpose to consider this case in this study.
Agreement good practices
In their often-cited paper,
Bland and Altman (1986) outlined the necessary conditions for the stability of a test over time: A test is perfectly stable if and only if the measurements realized at time
t1 on a sample of
n persons take the same exact values when repeated at a time
t2 >
t1 on the same sample and under the same conditions. If a high positive correlation between the two sets of measurements is a necessary condition, it is not a sufficient condition. Correlation measures globally the linearity of the relation between two sets of measurements, but not the equality of individual values between these two sets.
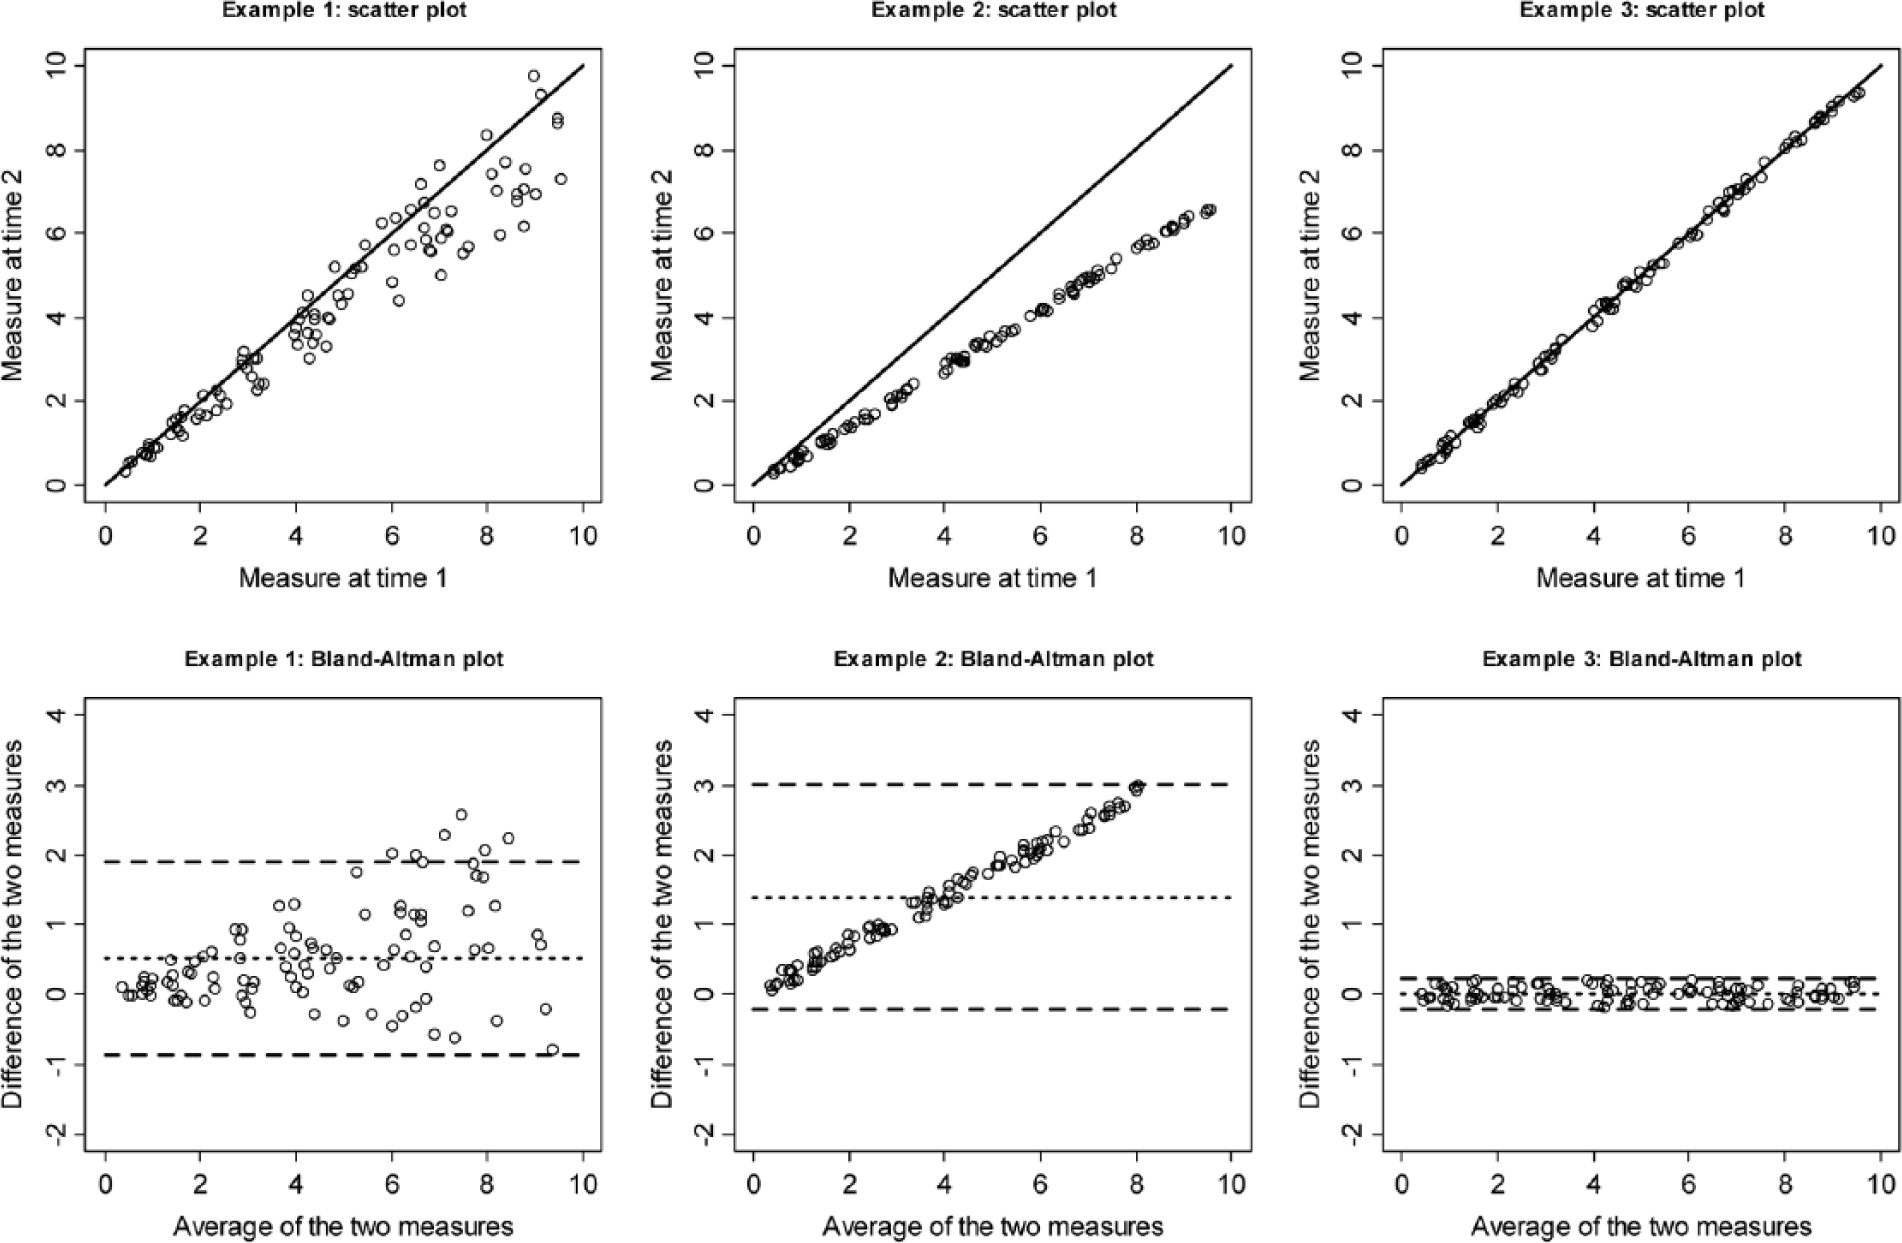
Figure 2 presents three fictive examples, where the correlation between two sets of measurements taken on a sample of
n = 100 persons is always very high, ranging from 0.97 to 0.99, and highly significant (
p < 0.001
1), indicating reliability. However, only the third example represents a situation, where the measurements taken on the second occasion are really similar to the measurements on the first occasion, implying agreement. In the first example, the difference between successive measurements taken on the same person is related to the value of the measurement, larger measurements implying a larger average error between both measurements. For instance, a person measured 8 on the first occasion can be measured anywhere between around 6 and 10 on the second occasion. In example 2, the second measurement is systematically smaller than the first one, the difference increasing with the level of the first measurement. These examples show that even if a high positive correlation between measurements is necessary to establish agreement, it is not a sufficient condition. Other conditions are also necessary to demonstrate agreement, but none is sufficient by itself. We can cite, for instance, the equality of the means, and the equality to one of the regression slope of one set of measurements to the other.
To demonstrate agreement, it is mandatory to show that values measured on two successive occasions are equal at the individual level for each respondent. As proposed in
Altman and Brand (1983), an approach is to relate the intra-individual mean of the successive measurements with the corresponding standard deviation. Any particular trend in this relation will indicate a non-stable behavior of the measurement over time. In the specific context of only two measurements (
t1 and
t2), the above comparison can be operationalized by comparing the absolute difference of the two measurements with their average. The resulting plot is known in the literature as the “Bland–Altman method” or the “Limits of Agreement” (LA) method.
Figure 2 shows this plot for the three numerical examples. As expected, a clear trend appears for the first two examples, but not for the third, indicating agreement.
Lin (1989,
2000) developed an alternative correct method for agreement assessment known as the
concordance correlation coefficient. This coefficient is defined as
where µ
1 and µ
2 denote the average of each series of measurements,
and
are the corresponding variances, and
is the covariance. In addition to Pearson’s correlation, Lin’s concordance coefficient also insures that the regression line of one set of measurement to the other has a unit slope and a null intercept. It takes values between −1 and 1, its absolute value being not larger than the absolute value of the corresponding Pearson’s correlation. Following
McBride (2005), values of at least 0.95 are necessary to indicate good agreement properties. On the examples in
Figure 2, the concordance coefficient behaves as expected, indicating a moderate agreement for example 1,
; a poor agreement for example 2,
; and a near perfect agreement for example 3,
.
As pointed out by
Nickerson (1997), Lin’s concordance coefficient is very close, even if not strictly identical, to four different ICCs (
McGraw and Wong, 1996a,
1996b). He concluded then that these versions of ICC can also be used to reliably establish repeatability, what seems reasonable. To be more precise, let us recall the basics of ICCs. In generic form, an ICC can be written as
where
denotes the between group variance of the two successive sets of measurement, and
denotes the within group variance. The ICC can then be interpreted as the percentage of total variance being explained by the decomposition of the data into two groups. On the contrary of the Pearson’s correlation coefficient, which is an inter-class coefficient, where data from the two sets of measurements to be compared are not commutable, ICCs are generally used in situations where the order of the two measurements is unimportant. This is not the case for test–retest, since there is a clear temporal order of the two measurements, and classical ICCs are then not well-suited for the assessment of repeatability. However, the ICCs developed by
McGraw and Wong (1996a,
1996b) are designed for situations where the measurements are non-commutable, what qualifies them for assessing repeatability. In practice, as shown in
Table 1, some authors used ICCs for test–retest assessment, but since they did not specify which ICC was used, it is impossible for the reader to distinguish between correct and incorrect studies.
Discussion
The term “test–retest” often recovers two different notions: The first one is a real test of agreement as previously described. The other one, sometimes called test–retest correlation, considers only reliability, generally on the basis of the sole Pearson’s correlation, but as previously indicated, this coefficient by itself can only indicate the degree of association between the two sets of measurements and not their equality. It is true that one can be sometimes more interested in the relative ranking of scores rather than on their exact value, but this has to be clearly stated. For instance, it could be viewed as sufficient for a depression scale to score always higher for depressed patients than for controls, even if the scores obtained by depressed patients vary from one testing occasion to another. Nevertheless, such a behavior of the scale can also imply that respondents are learning how to answer to the test items, a clearly less favorable finding. Moreover, in most reported studies, the value of the correlation used for the test–retest assessment is far from one, therefore, not only are scores different on the two occasions, but a high variability of the scores on the second testing occasion can be observed even for a subsample of respondents having scored the same value on the first occasion.
The use of both reliability and agreement would not be problematic, if users were fully aware of the implications of each approach. Unfortunately, it appears not to be the case and the generic “test–retest” term is generally used to mean both reliability and agreement. For instance,
Watson (2004) examined the test–retest practices in the field of personality assessment, but only from the perspective of Pearson’s correlation. If we can agree with the findings of this article, we regret that it never mentions that even a perfect positive correlation is absolutely not a proof of equal responses between the two testing occasions. We can even hypothesize that such papers contribute to the misconceptions that still dominate the notion of test–retest. Moreover, many researchers seem to simply compute the correlation between both sets of measurements and conclude that the value is sufficiently high to indicate good repeatability properties, regardless of the value of the achieved correlation, the sample size, or the time gap between the testing occasions (
Watson, 2004). At this point, it could be worth remembering that (1) Pearson’s correlation can only detect linear relationships between variables and (2) on large samples, a highly statistically significant correlation does not imply that the correlation coefficient itself is far from zero. As proposed in most statistics text books (e.g.
Wonnacott and Wonnacott, 1990), to really understand the relationship between two continuous variables, the easiest solution is still to plot them on a scatter plot. A visual inspection can then indicate if a substantial relationship occurs, whether linear or non-linear, so the risk of over-interpretation of the correlation coefficient will be reduced (e.g.
Mukaka, 2012).
To the discharge of test–retest users, it must be acknowledged that correct methods for agreement, such as Bland–Altman’s plot or the concordance correlation coefficient, are still not yet directly available in standard commercial statistical packages, such as SAS, Stata, and SPSS. In some cases, third-party developed functions are available. This is also the case of the open source R package, which is by essence developed by its user community. Regarding the ICC, even if all statistical packages offer at least one version of ICC, it is generally unclear which one is computed. On the other hand, it is also true that even without the use of specialized statistical packages, Bland–Altman plots and the concordance correlation coefficient are quite easy to produce. Therefore, even if the current confusion regarding reliability and agreement could be partly attributed to the insufficiency in the current statistical software, these tools should not be considered as the cause of the problem.
Altman and Brand (1983) wrote, “
It is to be hoped that journals will become enlightened and return papers using inappropriate techniques for reanalysis.” Unfortunately, they did not seem to have been heard. We know that many necessary changes can take a long time to be effective, but the results in
Table 1 are much worse than what we had anticipated at the beginning of this research. Even if established scales and measurement tools are in many cases perfectly correct and adapted to longitudinal as well as cross-sectional studies, we should always bear in mind that using a tool to compare and discriminate between individuals measured once, and analyzing the evolution across time of a measurement, are two related but different tasks. When the objective is really to work on longitudinal data, we should check that our measurement tool has been validated for agreement and not only for reliability. Otherwise, the risk to misinterpret results is high. For instance, if a significant difference between the means of two successive measurements on the same person is observed, this result is likely to be interpreted as an evolution of these respondents. However, this interpretation will be correct only if the measurement tool has good agreement properties. On the other hand, if the tool was only tested for reliability, it becomes impossible to distinguish between a real evolution of the respondents and a simple flaw of the measurement tool.
We acknowledge that in real conditions, perfect agreement is more a theoretical concept than a reality, since many impossible to control factors can influence the measurement. However, a perfect agreement should always be the objective because lowering expectations can only lead to unsatisfactory tools. This is in line with the ongoing debate around the need for scientific results to be reproducible (
The Academy of Medical Sciences, 2015). If a measurement is in essence imperfect, how could it be reproducible? Similar to test–retest, we can mention the notion of inter-rater reliability, where the goal is to reach the same judgment on the same respondents from different evaluators (
Hallgren, 2012). To broaden the debate even more, we can also draw attention to the fact that in addition to performing twice (or even more time) the same measurements on the same respondents, there is also the issue of being just able to examine twice the same persons. For instance, we can mention the capture–recapture method used to evaluate the size of difficult to reach population (
Williams and Cheal, 2002) and the phenomenon of attrition in panel surveys (
Lugtig, 2014).
From my perspective, the misconceptions surrounding test–retest procedures come from a combination between a lack of statistical education and the force of habits. When hundreds or thousands of papers written by eminent researchers have been published using the same statistical approach, this approach becomes a kind of law against which no one thinks to go. If you combine this point with a misinterpretation of the true meaning of the Pearson’s correlation coefficient, and a lack of information regarding alternatives, then you will just repeat and repeat again the same reasoning and computation. In some sense, you will be well-advised to do so since no one will tell you to stop and you will get published. To break such a circle, a good solution lies in education. It is very simple to demonstrate the difference between reliability and agreement and the limitations of correlation. An example such as
Figure 2 can prove sufficient for that purpose. Even if it can sound evident for most readers, the figures in
Table 1, as well as my own recent experiences, demonstrate that the road is still long, therefore, I will make sure that none of my students graduate without fully understanding these notions.
We are convinced for years that evaluation tools used in longitudinal studies have to be checked for agreement in addition to reliability, and this article was written with the goal to convince other people of this necessity. For instance, developers of new tests should systematically consider reliability and agreement and choose carefully the methods used to assess these properties. This is not because many publications are still relying on Pearson’s correlation that they should be followed. Moreover, analyses must be completely described. In particular, when working with ICCs, their exact type (or even formula) should be provided. Finally, we should also remember that a visual check of the data is often as instructive as the computation of complicated numerical coefficients. Similar warnings also apply to the reviewers of scientific papers. The exact nature of test–retest is still often misunderstood, therefore, this kind of analyses should be carefully checked. Teachers of statistics could put more emphasis on the correct interpretation of correlation and on the difference between reliability and agreement, especially at the undergraduate level. Finally, the end users of measurement tools, which are by far the largest share of the concerned population, should be aware that some of the tools they are using may not have all the properties they need, so in the case of unaccountable experiment results, the tools should also be examined, for instance, by looking at the publications which have established their test–retest properties. Presently, longitudinal studies are becoming the norm in many fields, and it is no longer admissible to use measurement tools whose test–retest properties are not fully established.